Assessing Marvell Tech: Insights From 16 Financial Analysts
Analysts' ratings for Marvell Tech (NASDAQ:MRVL) over the last quarter vary from bullish to bearish, as provided by 16 analysts.
The table below provides a concise overview of recent ratings by analysts, offering insights into the changing sentiments over the past 30 days and drawing comparisons with the preceding months for a holistic perspective.
| Bullish | Somewhat Bullish | Indifferent | Somewhat Bearish | Bearish | |
|---|---|---|---|---|---|
| Total Ratings | 10 | 4 | 2 | 0 | 0 |
| Last 30D | 1 | 0 | 0 | 0 | 0 |
| 1M Ago | 2 | 0 | 0 | 0 | 0 |
| 2M Ago | 7 | 3 | 1 | 0 | 0 |
| 3M Ago | 0 | 1 | 1 | 0 | 0 |
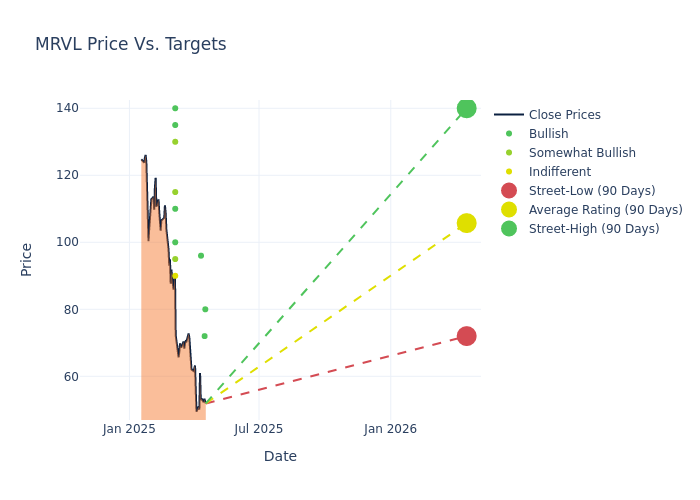
Providing deeper insights, analysts have established 12-month price targets, indicating an average target of $110.5, along with a high estimate of $140.00 and a low estimate of $72.00. This current average represents a 14.16% decrease from the previous average price target of $128.73.
Interpreting Analyst Ratings: A Closer Look
In examining recent analyst actions, we gain insights into how financial experts perceive Marvell Tech. The following summary outlines key analysts, their recent evaluations, and adjustments to ratings and price targets.
| Analyst | Analyst Firm | Action Taken | Rating |Current Price Target| Prior Price Target | |--------------------|--------------------|---------------|---------------|--------------------|--------------------| |Tore Svanberg |Stifel |Lowers |Buy | $80.00|$115.00 | |Vivek Arya |B of A Securities |Lowers |Buy | $72.00|$120.00 | |Atif Malik |Citigroup |Lowers |Buy | $96.00|$122.00 | |Joseph Moore |Morgan Stanley |Lowers |Equal-Weight | $90.00|$113.00 | |Tore Svanberg |Stifel |Lowers |Buy | $115.00|$130.00 | |Atif Malik |Citigroup |Lowers |Buy | $122.00|$136.00 | |Gary Mobley |Loop Capital |Announces |Buy | $110.00|- | |Harsh Kumar |Piper Sandler |Lowers |Overweight | $95.00|$120.00 | |Thomas O'Malley |Barclays |Lowers |Overweight | $130.00|$150.00 | |John Vinh |Keybanc |Lowers |Overweight | $115.00|$135.00 | |Vivek Arya |B of A Securities |Lowers |Buy | $120.00|$150.00 | |Cody Acree |Benchmark |Maintains |Buy | $135.00|$135.00 | |Kevin Cassidy |Rosenblatt |Maintains |Buy | $140.00|$140.00 | |Quinn Bolton |Needham |Lowers |Buy | $100.00|$120.00 | |Joseph Moore |Morgan Stanley |Lowers |Equal-Weight | $113.00|$120.00 | |John Vinh |Keybanc |Raises |Overweight | $135.00|$125.00 |
Key Insights:
- Action Taken: Analysts adapt their recommendations to changing market conditions and company performance. Whether they 'Maintain', 'Raise' or 'Lower' their stance, it reflects their response to recent developments related to Marvell Tech. This information provides a snapshot of how analysts perceive the current state of the company.
- Rating: Delving into assessments, analysts assign qualitative values, from 'Outperform' to 'Underperform'. These ratings communicate expectations for the relative performance of Marvell Tech compared to the broader market.
- Price Targets: Gaining insights, analysts provide estimates for the future value of Marvell Tech's stock. This comparison reveals trends in analysts' expectations over time.
Considering these analyst evaluations in conjunction with other financial indicators can offer a comprehensive understanding of Marvell Tech's market position. Stay informed and make well-informed decisions with our Ratings Table.
Stay up to date on Marvell Tech analyst ratings.
About Marvell Tech
Marvell Technology is a fabless chip designer focused on wired networking, where it has the second-highest market share. Marvell serves the data center, carrier, enterprise, automotive, and consumer end markets with processors, optical and copper transceivers, switches, and storage controllers.
Unraveling the Financial Story of Marvell Tech
Market Capitalization: With restricted market capitalization, the company is positioned below industry averages. This reflects a smaller scale relative to peers.
Revenue Growth: Marvell Tech's remarkable performance in 3M is evident. As of 31 January, 2025, the company achieved an impressive revenue growth rate of 27.4%. This signifies a substantial increase in the company's top-line earnings. As compared to competitors, the company surpassed expectations with a growth rate higher than the average among peers in the Information Technology sector.
Net Margin: Marvell Tech's net margin falls below industry averages, indicating challenges in achieving strong profitability. With a net margin of 11.02%, the company may face hurdles in effective cost management.
Return on Equity (ROE): Marvell Tech's ROE is below industry averages, indicating potential challenges in efficiently utilizing equity capital. With an ROE of 1.49%, the company may face hurdles in achieving optimal financial returns.
Return on Assets (ROA): Marvell Tech's ROA is below industry averages, indicating potential challenges in efficiently utilizing assets. With an ROA of 1.0%, the company may face hurdles in achieving optimal financial returns.
Debt Management: Marvell Tech's debt-to-equity ratio surpasses industry norms, standing at 0.32. This suggests the company carries a substantial amount of debt, posing potential financial challenges.
Analyst Ratings: What Are They?
Analysts work in banking and financial systems and typically specialize in reporting for stocks or defined sectors. Analysts may attend company conference calls and meetings, research company financial statements, and communicate with insiders to publish "analyst ratings" for stocks. Analysts typically rate each stock once per quarter.
In addition to their assessments, some analysts extend their insights by offering predictions for key metrics such as earnings, revenue, and growth estimates. This supplementary information provides further guidance for traders. It is crucial to recognize that, despite their specialization, analysts are human and can only provide forecasts based on their beliefs.
Which Stocks Are Analysts Recommending Now?
Benzinga Edge gives you instant access to all major analyst upgrades, downgrades, and price targets. Sort by accuracy, upside potential, and more. Click here to stay ahead of the market.
This article was generated by Benzinga's automated content engine and reviewed by an editor.
① During the campaign period, US stocks, US stocks short selling, US stock options, Hong Kong stocks, and A-shares trading will maintain at $0 commission, and no subscription/redemption fees for mutual fund transactions. $0 fee offer has a time limit, until further notice. For more information, please visit: https://www.webull.hk/pricing
② More than 40M Downloads Globally : data based on Webull Technologies Limited's internal statistics as of July 14, 2023.
Webull Securities Limited is licensed with the Securities and Futures Commission of Hong Kong (CE No. BNG700) for carrying out Type 1 License for Dealing in Securities, Type 2 License for Dealing in Futures Contracts and Type 4 License for Advising on Securities.

English