Retail investors are Chain Bridge Bancorp, Inc.'s (NYSE:CBNA) biggest owners and were hit after market cap dropped US$17m
Key Insights
- Chain Bridge Bancorp's significant retail investors ownership suggests that the key decisions are influenced by shareholders from the larger public
- The top 10 shareholders own 51% of the company
- Recent purchases by insiders
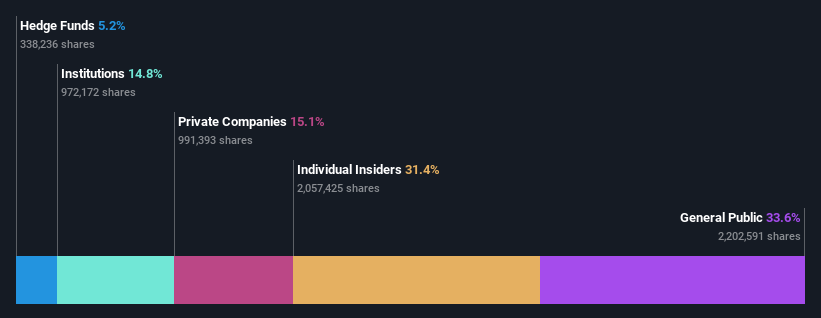
To get a sense of who is truly in control of Chain Bridge Bancorp, Inc. (NYSE:CBNA), it is important to understand the ownership structure of the business. With 34% stake, retail investors possess the maximum shares in the company. That is, the group stands to benefit the most if the stock rises (or lose the most if there is a downturn).
While insiders who own 31% came under pressure after market cap dropped to US$145m last week,retail investors took the most losses.
Let's delve deeper into each type of owner of Chain Bridge Bancorp, beginning with the chart below.
View our latest analysis for Chain Bridge Bancorp
What Does The Institutional Ownership Tell Us About Chain Bridge Bancorp?
Many institutions measure their performance against an index that approximates the local market. So they usually pay more attention to companies that are included in major indices.
As you can see, institutional investors have a fair amount of stake in Chain Bridge Bancorp. This can indicate that the company has a certain degree of credibility in the investment community. However, it is best to be wary of relying on the supposed validation that comes with institutional investors. They too, get it wrong sometimes. It is not uncommon to see a big share price drop if two large institutional investors try to sell out of a stock at the same time. So it is worth checking the past earnings trajectory of Chain Bridge Bancorp, (below). Of course, keep in mind that there are other factors to consider, too.
Our data indicates that hedge funds own 5.2% of Chain Bridge Bancorp. That's interesting, because hedge funds can be quite active and activist. Many look for medium term catalysts that will drive the share price higher. Looking at our data, we can see that the largest shareholder is Peter Fitzgerald with 17% of shares outstanding. Meanwhile, the second and third largest shareholders, hold 6.6% and 5.2%, of the shares outstanding, respectively. In addition, we found that John Brough, the CEO has 1.1% of the shares allocated to their name.
We did some more digging and found that 10 of the top shareholders account for roughly 51% of the register, implying that along with larger shareholders, there are a few smaller shareholders, thereby balancing out each others interests somewhat.
While it makes sense to study institutional ownership data for a company, it also makes sense to study analyst sentiments to know which way the wind is blowing. There are a reasonable number of analysts covering the stock, so it might be useful to find out their aggregate view on the future.
Insider Ownership Of Chain Bridge Bancorp
The definition of company insiders can be subjective and does vary between jurisdictions. Our data reflects individual insiders, capturing board members at the very least. Management ultimately answers to the board. However, it is not uncommon for managers to be executive board members, especially if they are a founder or the CEO.
Most consider insider ownership a positive because it can indicate the board is well aligned with other shareholders. However, on some occasions too much power is concentrated within this group.
Our most recent data indicates that insiders own a reasonable proportion of Chain Bridge Bancorp, Inc.. Insiders have a US$45m stake in this US$145m business. This may suggest that the founders still own a lot of shares. You can click here to see if they have been buying or selling.
General Public Ownership
With a 34% ownership, the general public, mostly comprising of individual investors, have some degree of sway over Chain Bridge Bancorp. This size of ownership, while considerable, may not be enough to change company policy if the decision is not in sync with other large shareholders.
Private Company Ownership
Our data indicates that Private Companies hold 15%, of the company's shares. It's hard to draw any conclusions from this fact alone, so its worth looking into who owns those private companies. Sometimes insiders or other related parties have an interest in shares in a public company through a separate private company.
Next Steps:
I find it very interesting to look at who exactly owns a company. But to truly gain insight, we need to consider other information, too.
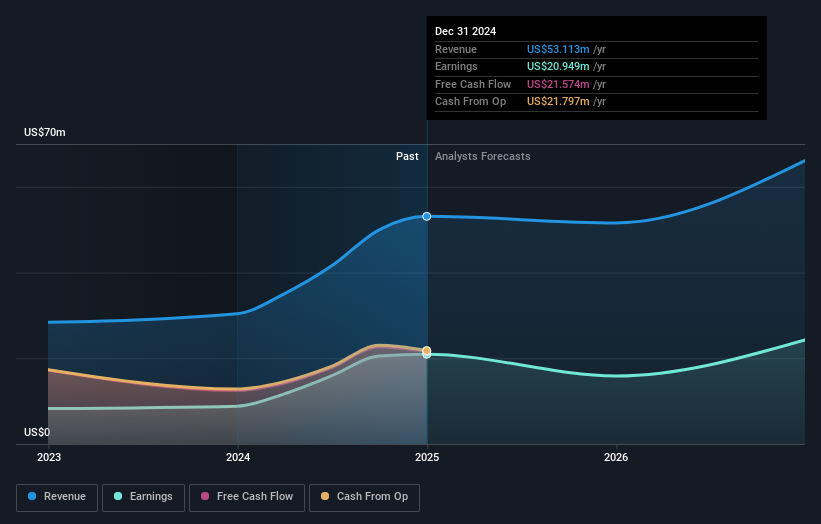
I like to dive deeper into how a company has performed in the past. You can access this interactive graph of past earnings, revenue and cash flow, for free .
But ultimately it is the future, not the past, that will determine how well the owners of this business will do. Therefore we think it advisable to take a look at this free report showing whether analysts are predicting a brighter future .
NB: Figures in this article are calculated using data from the last twelve months, which refer to the 12-month period ending on the last date of the month the financial statement is dated. This may not be consistent with full year annual report figures.
Have feedback on this article? Concerned about the content? Get in touch with us directly. Alternatively, email editorial-team (at) simplywallst.com.
This article by Simply Wall St is general in nature. We provide commentary based on historical data and analyst forecasts only using an unbiased methodology and our articles are not intended to be financial advice. It does not constitute a recommendation to buy or sell any stock, and does not take account of your objectives, or your financial situation. We aim to bring you long-term focused analysis driven by fundamental data. Note that our analysis may not factor in the latest price-sensitive company announcements or qualitative material. Simply Wall St has no position in any stocks mentioned.
① During the campaign period, US stocks, US stocks short selling, US stock options, Hong Kong stocks, and A-shares trading will maintain at $0 commission, and no subscription/redemption fees for mutual fund transactions. $0 fee offer has a time limit, until further notice. For more information, please visit: https://www.webull.hk/pricing
② More than 40M Downloads Globally : data based on Webull Technologies Limited's internal statistics as of July 14, 2023.
Webull Securities Limited is licensed with the Securities and Futures Commission of Hong Kong (CE No. BNG700) for carrying out Type 1 License for Dealing in Securities, Type 2 License for Dealing in Futures Contracts and Type 4 License for Advising on Securities.

English