Institutional investors in Graham Holdings Company (NYSE:GHC) lost 4.2% last week but have reaped the benefits of longer-term growth
Key Insights
- Given the large stake in the stock by institutions, Graham Holdings' stock price might be vulnerable to their trading decisions
- The top 7 shareholders own 53% of the company
- Insiders own 22% of Graham Holdings
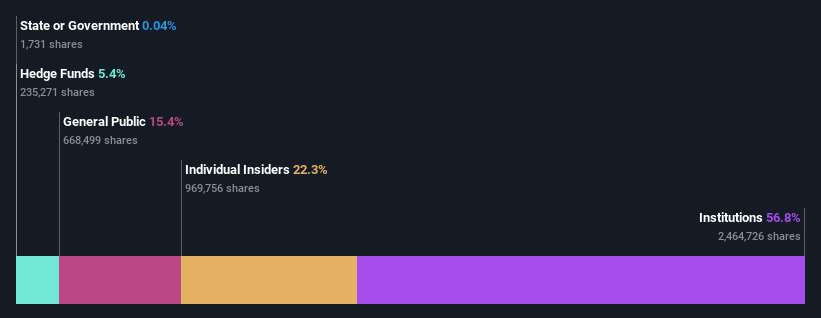
Every investor in Graham Holdings Company (NYSE:GHC) should be aware of the most powerful shareholder groups. And the group that holds the biggest piece of the pie are institutions with 57% ownership. That is, the group stands to benefit the most if the stock rises (or lose the most if there is a downturn).
Institutional investors endured the highest losses after the company's market cap fell by US$174m last week. However, the 26% one-year return to shareholders might have softened the blow. But they would probably be wary of future losses.
In the chart below, we zoom in on the different ownership groups of Graham Holdings.
See our latest analysis for Graham Holdings
What Does The Institutional Ownership Tell Us About Graham Holdings?
Institutions typically measure themselves against a benchmark when reporting to their own investors, so they often become more enthusiastic about a stock once it's included in a major index. We would expect most companies to have some institutions on the register, especially if they are growing.
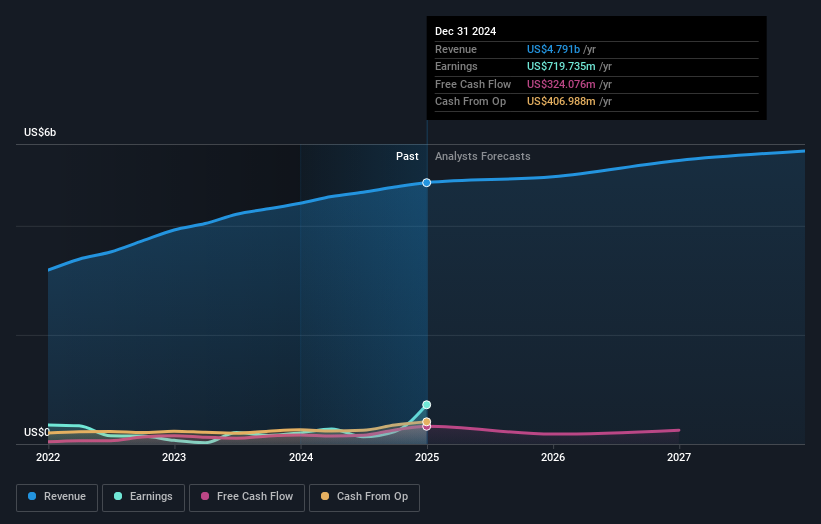
We can see that Graham Holdings does have institutional investors; and they hold a good portion of the company's stock. This suggests some credibility amongst professional investors. But we can't rely on that fact alone since institutions make bad investments sometimes, just like everyone does. If multiple institutions change their view on a stock at the same time, you could see the share price drop fast. It's therefore worth looking at Graham Holdings' earnings history below. Of course, the future is what really matters.
Since institutional investors own more than half the issued stock, the board will likely have to pay attention to their preferences. It looks like hedge funds own 5.4% of Graham Holdings shares. That catches my attention because hedge funds sometimes try to influence management, or bring about changes that will create near term value for shareholders. Our data shows that Donald Graham is the largest shareholder with 13% of shares outstanding. In comparison, the second and third largest shareholders hold about 9.8% and 7.7% of the stock. Additionally, the company's CEO Timothy O’Shaughnessy directly holds 6.5% of the total shares outstanding.
We also observed that the top 7 shareholders account for more than half of the share register, with a few smaller shareholders to balance the interests of the larger ones to a certain extent.
While it makes sense to study institutional ownership data for a company, it also makes sense to study analyst sentiments to know which way the wind is blowing. There is some analyst coverage of the stock, but it could still become more well known, with time.
Insider Ownership Of Graham Holdings
The definition of an insider can differ slightly between different countries, but members of the board of directors always count. The company management answer to the board and the latter should represent the interests of shareholders. Notably, sometimes top-level managers are on the board themselves.
I generally consider insider ownership to be a good thing. However, on some occasions it makes it more difficult for other shareholders to hold the board accountable for decisions.
Our most recent data indicates that insiders own a reasonable proportion of Graham Holdings Company. It has a market capitalization of just US$4.0b, and insiders have US$883m worth of shares in their own names. That's quite significant. Most would be pleased to see the board is investing alongside them. You may wish to access this free chart showing recent trading by insiders.
General Public Ownership
The general public-- including retail investors -- own 15% stake in the company, and hence can't easily be ignored. While this group can't necessarily call the shots, it can certainly have a real influence on how the company is run.
Next Steps:
It's always worth thinking about the different groups who own shares in a company. But to understand Graham Holdings better, we need to consider many other factors. For instance, we've identified 1 warning sign for Graham Holdings that you should be aware of.
But ultimately it is the future, not the past, that will determine how well the owners of this business will do. Therefore we think it advisable to take a look at this free report showing whether analysts are predicting a brighter future.
NB: Figures in this article are calculated using data from the last twelve months, which refer to the 12-month period ending on the last date of the month the financial statement is dated. This may not be consistent with full year annual report figures.
Have feedback on this article? Concerned about the content? Get in touch with us directly. Alternatively, email editorial-team (at) simplywallst.com.
This article by Simply Wall St is general in nature. We provide commentary based on historical data and analyst forecasts only using an unbiased methodology and our articles are not intended to be financial advice. It does not constitute a recommendation to buy or sell any stock, and does not take account of your objectives, or your financial situation. We aim to bring you long-term focused analysis driven by fundamental data. Note that our analysis may not factor in the latest price-sensitive company announcements or qualitative material. Simply Wall St has no position in any stocks mentioned.
① During the campaign period, US stocks, US stocks short selling, US stock options, Hong Kong stocks, and A-shares trading will maintain at $0 commission, and no subscription/redemption fees for mutual fund transactions. $0 fee offer has a time limit, until further notice. For more information, please visit: https://www.webull.hk/pricing
② More than 40M Downloads Globally : data based on Webull Technologies Limited's internal statistics as of July 14, 2023.
Webull Securities Limited is licensed with the Securities and Futures Commission of Hong Kong (CE No. BNG700) for carrying out Type 1 License for Dealing in Securities, Type 2 License for Dealing in Futures Contracts and Type 4 License for Advising on Securities.

English