CT Vision S.L. (International) Holdings Limited (HKG:994) May Have Run Too Fast Too Soon With Recent 48% Price Plummet
CT Vision S.L. (International) Holdings Limited (HKG:994) shares have retraced a considerable 48% in the last month, reversing a fair amount of their solid recent performance. For any long-term shareholders, the last month ends a year to forget by locking in a 57% share price decline.
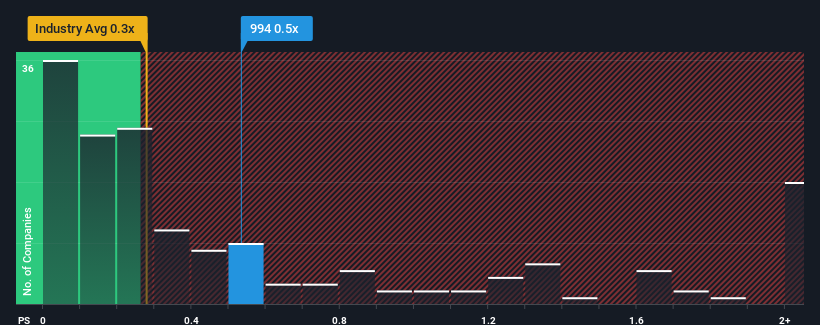
Although its price has dipped substantially, you could still be forgiven for feeling indifferent about CT Vision S.L. (International) Holdings' P/S ratio of 0.5x, since the median price-to-sales (or "P/S") ratio for the Construction industry in Hong Kong is also close to 0.3x. Although, it's not wise to simply ignore the P/S without explanation as investors may be disregarding a distinct opportunity or a costly mistake.
See our latest analysis for CT Vision S.L. (International) Holdings
How CT Vision S.L. (International) Holdings Has Been Performing
It looks like revenue growth has deserted CT Vision S.L. (International) Holdings recently, which is not something to boast about. Perhaps the market believes the recent run-of-the-mill revenue performance isn't enough to outperform the industry, which has kept the P/S muted. If not, then existing shareholders may be feeling hopeful about the future direction of the share price.
Although there are no analyst estimates available for CT Vision S.L. (International) Holdings, take a look at this free data-rich visualisation to see how the company stacks up on earnings, revenue and cash flow.What Are Revenue Growth Metrics Telling Us About The P/S?
In order to justify its P/S ratio, CT Vision S.L. (International) Holdings would need to produce growth that's similar to the industry.
If we review the last year of revenue, the company posted a result that saw barely any deviation from a year ago. Regardless, revenue has managed to lift by a handy 7.8% in aggregate from three years ago, thanks to the earlier period of growth. So it appears to us that the company has had a mixed result in terms of growing revenue over that time.
Comparing that to the industry, which is predicted to deliver 9.4% growth in the next 12 months, the company's momentum is weaker, based on recent medium-term annualised revenue results.
With this information, we find it interesting that CT Vision S.L. (International) Holdings is trading at a fairly similar P/S compared to the industry. It seems most investors are ignoring the fairly limited recent growth rates and are willing to pay up for exposure to the stock. Maintaining these prices will be difficult to achieve as a continuation of recent revenue trends is likely to weigh down the shares eventually.
What We Can Learn From CT Vision S.L. (International) Holdings' P/S?
Following CT Vision S.L. (International) Holdings' share price tumble, its P/S is just clinging on to the industry median P/S. Using the price-to-sales ratio alone to determine if you should sell your stock isn't sensible, however it can be a practical guide to the company's future prospects.
We've established that CT Vision S.L. (International) Holdings' average P/S is a bit surprising since its recent three-year growth is lower than the wider industry forecast. Right now we are uncomfortable with the P/S as this revenue performance isn't likely to support a more positive sentiment for long. Unless there is a significant improvement in the company's medium-term performance, it will be difficult to prevent the P/S ratio from declining to a more reasonable level.
We don't want to rain on the parade too much, but we did also find 3 warning signs for CT Vision S.L. (International) Holdings (1 is a bit concerning!) that you need to be mindful of.
Of course, profitable companies with a history of great earnings growth are generally safer bets. So you may wish to see this free collection of other companies that have reasonable P/E ratios and have grown earnings strongly.
Have feedback on this article? Concerned about the content? Get in touch with us directly. Alternatively, email editorial-team (at) simplywallst.com.
This article by Simply Wall St is general in nature. We provide commentary based on historical data and analyst forecasts only using an unbiased methodology and our articles are not intended to be financial advice. It does not constitute a recommendation to buy or sell any stock, and does not take account of your objectives, or your financial situation. We aim to bring you long-term focused analysis driven by fundamental data. Note that our analysis may not factor in the latest price-sensitive company announcements or qualitative material. Simply Wall St has no position in any stocks mentioned.
① During the campaign period, US stocks, US stocks short selling, US stock options, Hong Kong stocks, and A-shares trading will maintain at $0 commission, and no subscription/redemption fees for mutual fund transactions. $0 fee offer has a time limit, until further notice. For more information, please visit: https://www.webull.hk/pricing
② More than 40M Downloads Globally : data based on Webull Technologies Limited's internal statistics as of July 14, 2023.
Webull Securities Limited is licensed with the Securities and Futures Commission of Hong Kong (CE No. BNG700) for carrying out Type 1 License for Dealing in Securities, Type 2 License for Dealing in Futures Contracts and Type 4 License for Advising on Securities.

English